
The General Ledger Dashboard is only available for accounts when the journalizing engine has been activated. Verify with your Actuals Implementation Consultant if these reports are available for your account.
This documentation outlines the standard financial reporting and transaction layers of our Actuals platform. Understanding these modules is key to navigating the "funnel" logic—moving from high-level financial dashboards (Balance Sheet & PNL) down to the granular specifics of an individual transaction (Journal Entry).
1. Balance Sheet & Profit and Loss Statement
The Balance Sheet and Profit & Loss Statement represent the highest level of financial reporting. These reports aggregate all organizational data on general ledger accounts and display the totals per period. The general ledger accounts are groups in a reporting structure.
- The Balance Sheet: Displays Assets, Liabilities, and Equity at a specific point in time. It follows the fundamental accounting equation: Assets = Liabilities + Equity
- The Profit and Loss (P&L): Summarizes revenues, costs, and expenses incurred during a specific period. It indicates the net profit or loss generated by the business.
The Funnel Path: To understand what makes up a specific general ledger account (e.g., "Accounts Receivable" or "Sales Revenue"), simply right-click on a general ledger account of the statement and click on ‘’view ledger details’’. This will take you directly to the Ledger Details report for that specific general ledger account.
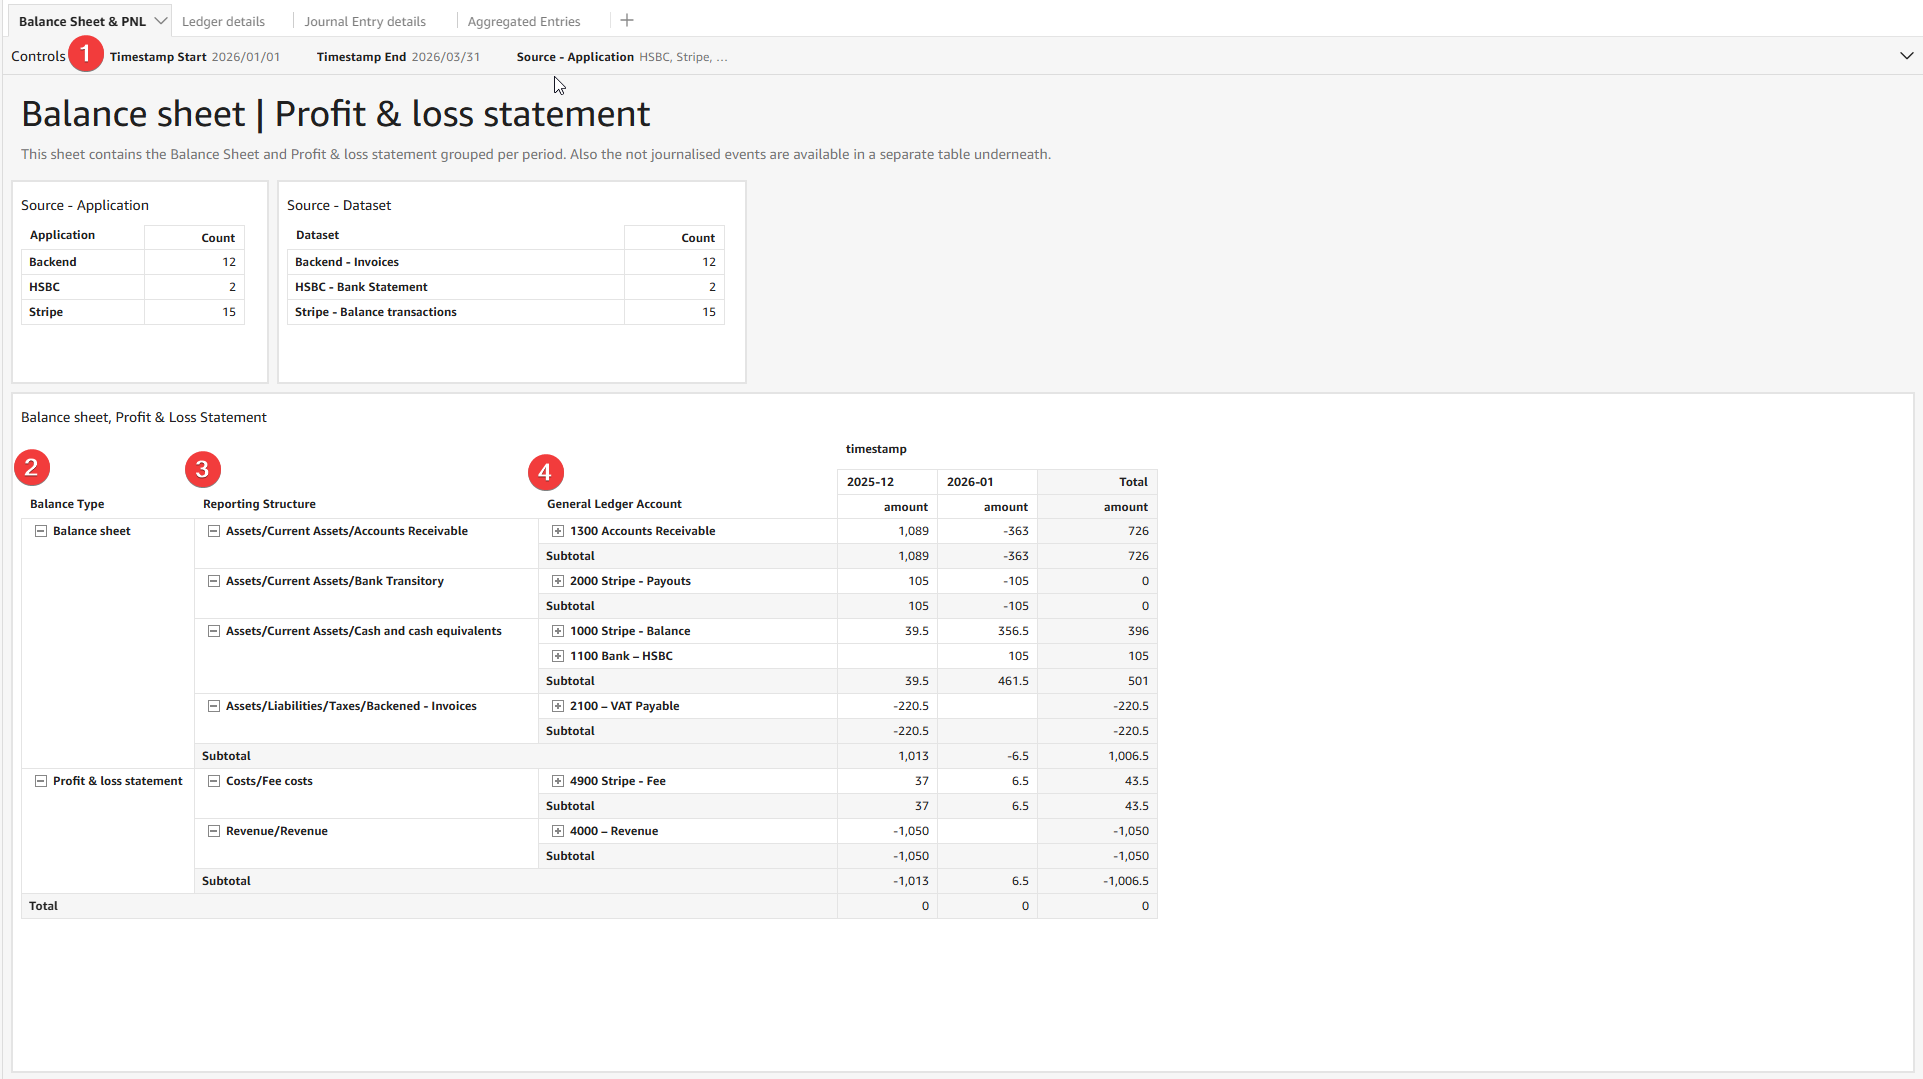
1. Use the timestamp filtering to view data for a given period
2. Data gets distinguished between Balance Sheet and Profit & Loss Statement
3. General ledger Accounts are being grouped by a reporting structure
4. The General Ledger Accounts can be right clicked to analyze which transactions make up this total mutation.
2. General Ledger Account Details
The General Ledger Account details serves as the intermediate layer of your financial data. While the Balance Sheet shows you the total balance of a general ledger account, the Ledger shows you the activity that resulted in that balance.
- Chronological Tracking: View every transaction associated with a specific General Ledger account or a source over a selected date range. A date range can be selected by clicking on the ‘’controls’’ bar, and choosing a start and end date.
- Filtering: You can use the ‘’controls’’ bar to filter ledger by General Ledger Account or a certain transaction identifier
A general ledger account mutation is created by a journal entry. Separate journal entries can be identified by their transaction id. If you want to dive-deeper into a journal entry, right-click the transaction. Click the view Journal Entry Details button to reveal view the full journal entry of the event that impacted that specific general ledger account.
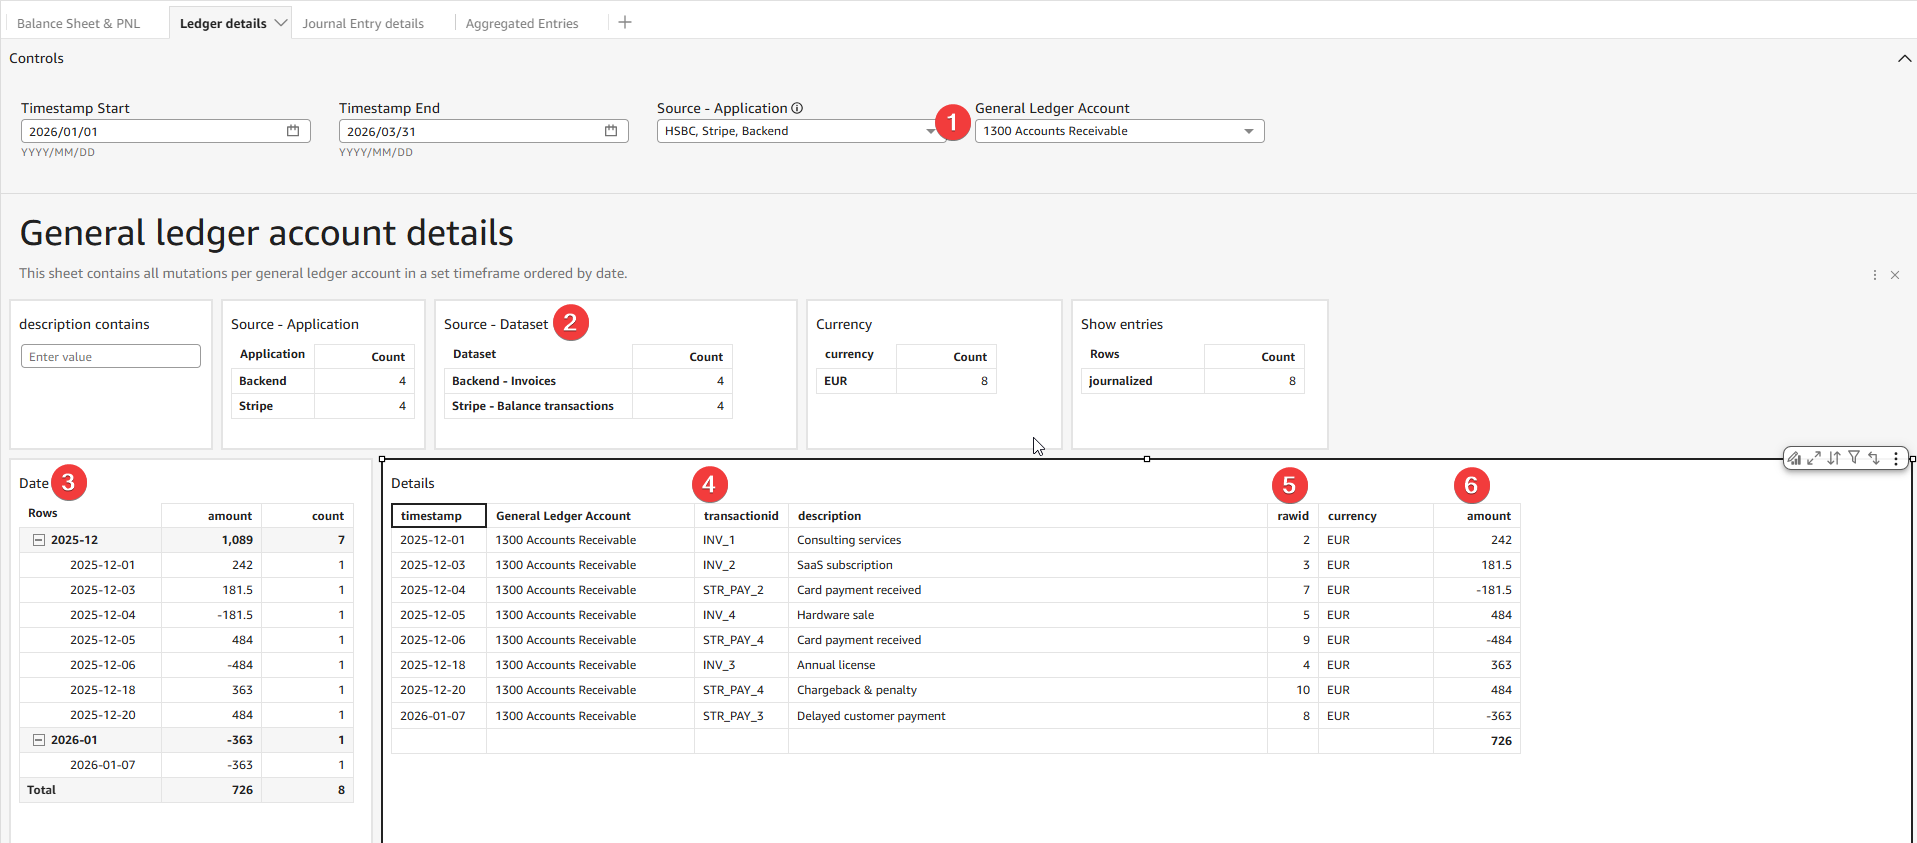
1. Filter on a specific General Ledger Account
2. Filter on specific sources impacting the General Ledger Account
3. View and filter on which periods and dates transactions are impacting the general ledger Account
4. These are the transaction id’s (Journal entries) that are impacting the General Ledger Account. Right click “View Journal Entry Details” to view the details of that individual journal entry.
5. These are the link to the raw data from which the journal entry was created. Right click “View raw id” to open the raw transaction viewer and see which data was provided.
6. The amount how the general Ledger Account was impacted.
3. Journal Entry Details
The Journal Entry is the "source of truth" and the most granular level of the funnel. Every financial event—be it an invoice, a payment, or a manual adjustment—starts here.
- Core Components: Contains the effective date, balanced debits and credits, and the specific user metadata for a complete audit trail.
- Transaction ID Search: Use the ’’transactionid’’ search for pinpoint accuracy when you need to jump directly to a specific record using an external reference or id number.
- Configurable Description Search: Quickly locate entries by filtering through the description line. By using uniform descriptions you can easily use this field to quickly aggregate transactions. The description search can be a powerful tool, contact your Actuals consultant to improve and optimise its functions.
The Journal Entry is the foundation of your data. Once saved, these details are automatically summarized into the Ledger Details, which in turn populate the final figures on your Balance Sheet and P&L.
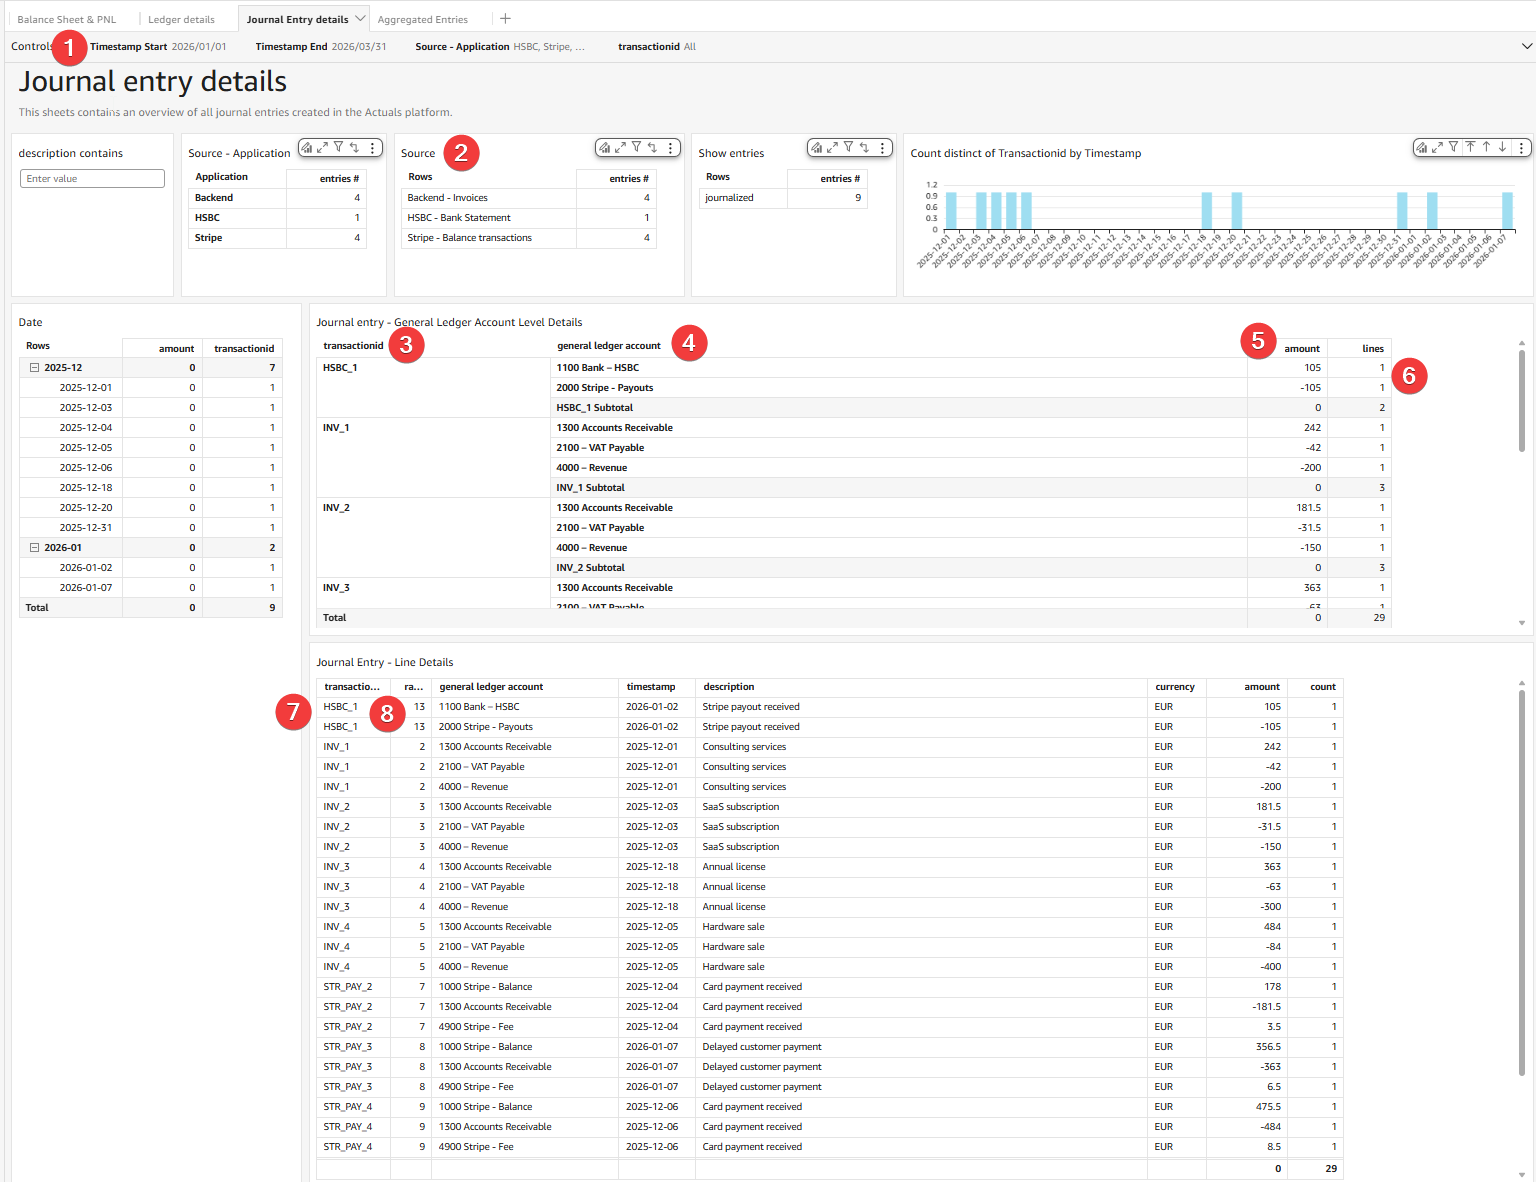
1. Filter the timeframe
2. View transactions originating from a specific source.
3. View the journal entry created per transaction id (on General Ledger Account level)
4. See which general ledger accounts are used in that journal entry.
5. The impact for each general ledger account.
6. How many journal entry lines hit that general ledger account.
7. Transaction line level details per journal entry.
8. The raw id from which the journal entry was created. Right click “View Raw Id” to open the raw data in the raw data viewer.