
The first page available after logging in is the overview page. The overview page shows the matching results for different matching packages that have been setup. When reporting the matching details, the metrics are always shown per source. Sources can be part of multiple matching packages as the transactions in the sources can be compared with different expected results in several other systems. For instance, data in a ERP system can be compared with PSP data in one matching package and with an accounting system in another matching package. The Actuals platform will store the matching results for each matching package individually. For details on the matching process, please visit the Methodology page.
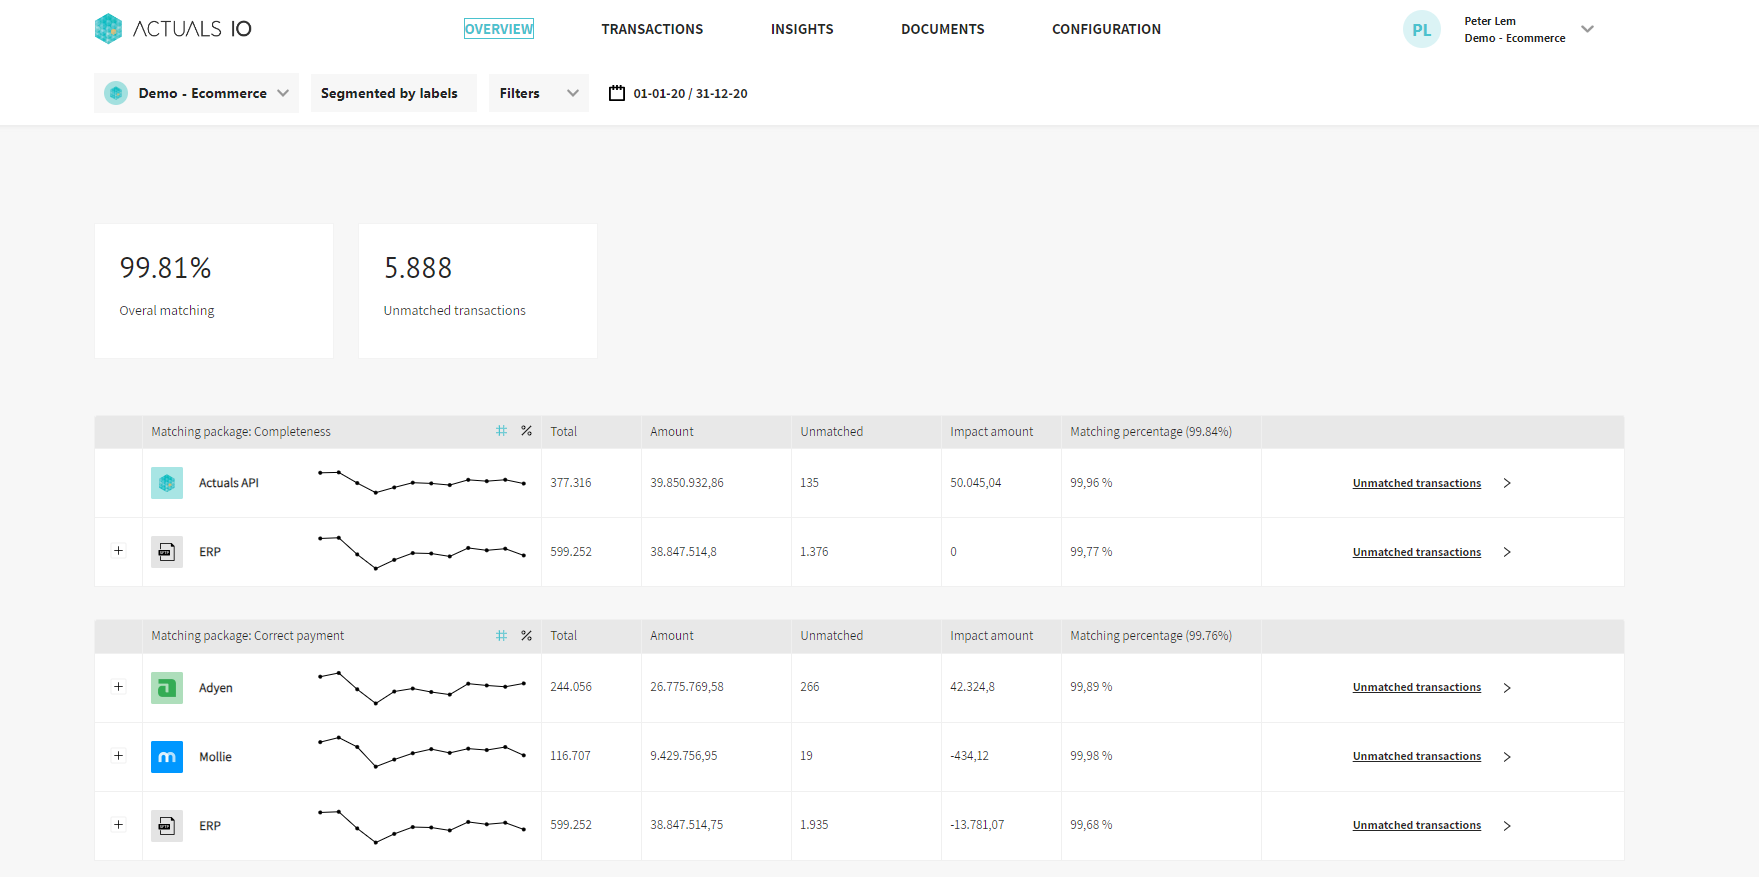
The following metrics are available per source per matching package
- Total: the total number of (transaction) rows for that source
- Amount: the sum of the amount of all the rows for that sources. Note that depending on the setup of the source, this can be local currency or converted to EUR
- Unmatched: the total number of rows for that source that are not processed or have a matching status unmatched. So this included transactions that been processed from the raw data, but that have not been part of a matching run. Additionally this also includes transactions that have been part of a matching run but that don’t meet the matching requirements and are not explained by either an explanation rule or a manual explanation
- Impact amount: the sum of the balancing difference of all unmatched transactions in that source (Not processed transactions are excluded!). Note that the difference is not absolute as illustrated by the following example
source | transactionid | amount | balancedifference / impact amount |
A | 123 | 60 | -20 |
B | 123 | 80 | -20 |
A | 124 | 70 | 10 |
B | 124 | 60 | 10 |
A | 125 | 30 | 30 |
In this case the impact amount for source A will be -20+10+30 = 20, the impact amount for source B will be -20+10 = -10.
- Matching percentage: the number of rows that are either matched or explained divided by the total number of rows
The unmatched transactions link can be used navigate to the transactions page and show the unmatched transactions for that source for that matching package.
Filters and segments
At the top of the page several filters can be used to filter the overview page on some specific values. The data indicator can be used to filter the reported data on a specific date range.
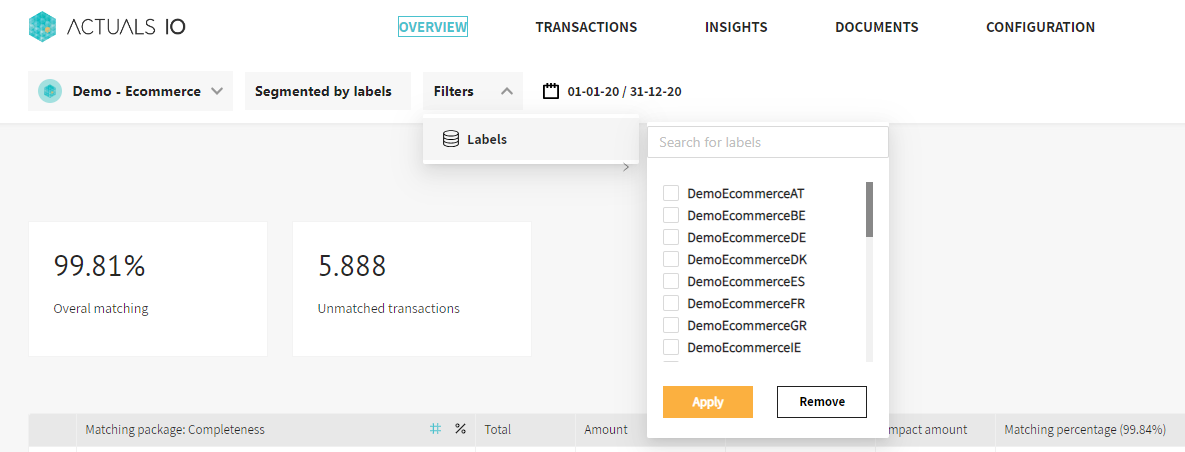
Initially the data is not filtered on any date. Note that the matching process itself has no limitations on the differences of the timestamp, it might be recommend to filter on a specific start date to get the most accurate results. Apart from filtering, the data can also be segmented on labels, balancepatterngrouped and explaincategory. By segmenting the matching data on these different parameters end users have a better understanding of the overall matching status. The label segment is typically used to segment the data on merchants or countries. It can be the case that there is one specific label that is causing a lot of the mismatches which is illustrated by a low matching percentage for that label. The balancepatterngrouped property segments the matching data for a source in three categories: data only in first set of sources, data only in second set of sources or data in both source. The first two categories illustrate that transaction don’t match because the corresponding transaction in the other set of sources cannot be found. The resolution is to review the setup of the parameter used for matching and to doublecheck that all relevant data is in the platform for the other source. If the balancepatterngrouped illustrates a different amount, the transaction is found in both sources but the amount is different. The resolution is then to review the use of foreign currencies, vat or discounts causing the mismatch. The third segment that is available is the explanationcategory. Transactions can be bucketed into the categories based on explanation rules and they group the transactions into usefull groups that typicall have their own specific cause and resolution. For all of the segments, it is possible to click Filters to the right and to filter on specific values for that segment
Other functionality
The overview page also contains a trend line per source. Initially this shows the trend in the total transactions for the filtered date range. Clicking on the percentage icon at the right of the name of the matching package shows a trend of the matching percentage over time. This helps in finding specific date ranges where the matching was low. By filtering on these date ranges as a next step, unmatched transactions can be further analyzed.